Circularity Map · Any City

Make cities measurable.
One neighborhood at a time.

PostGIS-powered circularity scores, temporal change, and land surface temperature — in one interactive view for planners and researchers.

Get started → Request a demo
8+
Neighborhoods
4
Map Layers
2
Years Tracked
GIS
PostGIS Native

Aerial view of a Mediterranean city with three GeoAI analysis zones, public transit, green infrastructure, and solar rooftops
Circularity Urban heat Public space
Urban Analytics
CS Score
84.2
+2.4% ↑
LST avg
28.6°
-1.1° ↓
Carbon
12k
tons offset
LIVE
Mitte · Berlin
CS 2023: 84.2 vs 2016: 81.8
SDG Progress75%
SDG 11
SDG 13
SDG 7
SDG 12

Research from

University of SevilleUniversity of Siegen

Seville · 2016—2023

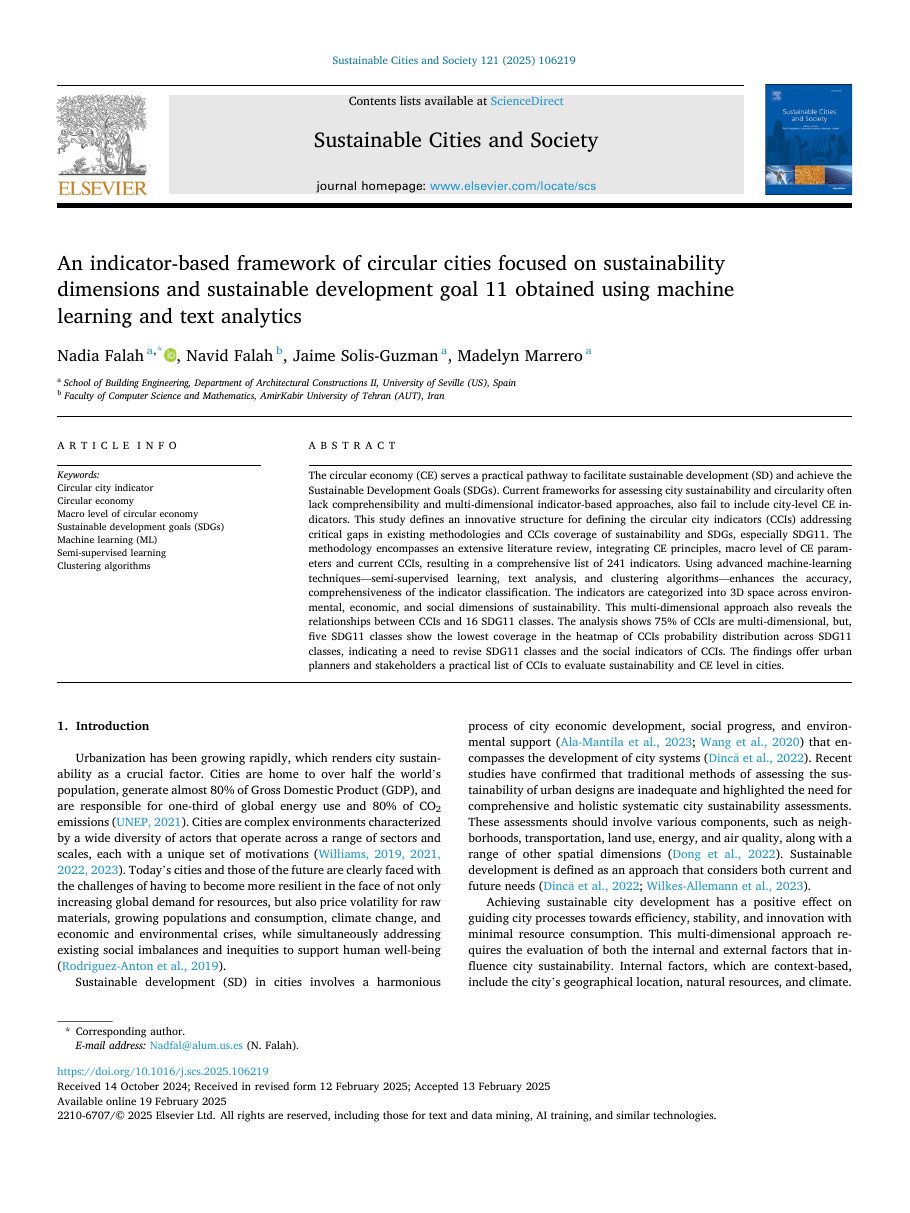
Urban circularity,
measured over time.

Seville’s circularity score improved by 3.56 percentage points, with substantial gains across land, green infrastructure, and circular-flow metrics.

CS 2016 33.49% 6.55 / 19.573
CS 2023 37.05% 7.25 / 19.573
Change +3.56pp 2016 to 2023
Ideal benchmark

Progress toward ideal circularity score

19.573 = 100%

201633.49%
202337.05%
2016—2023

Top improving metrics

% change

  1. LWZLand-use metric+900%
  2. EGFGreen-flow metric+900%
  3. CFACircular-flow metric+152%
  4. PBAPublic-space metric+6.4%
  5. EIEEnergy metric+2.8%

SDG 11 alignment

A balanced view of
urban sustainability.

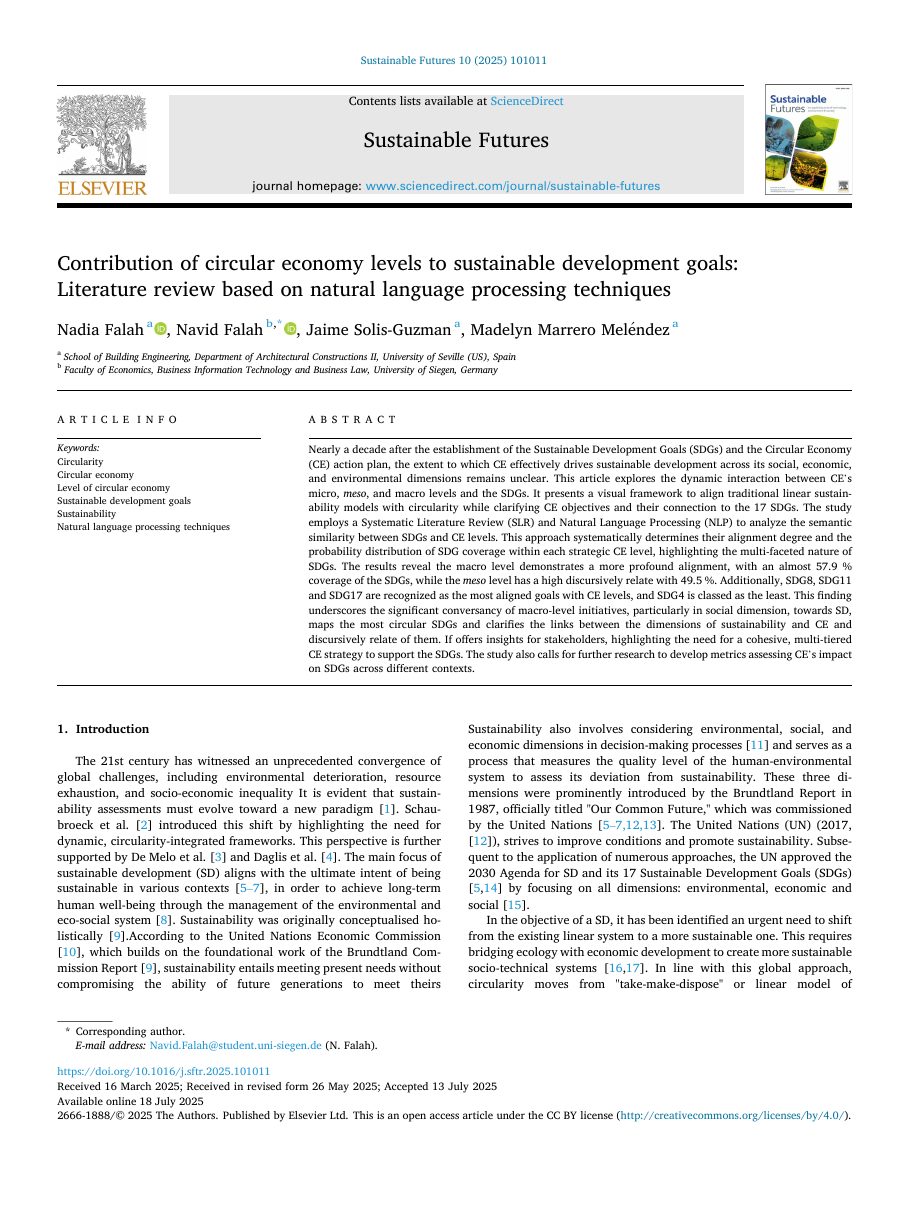
The indicator framework spans the three dimensions of sustainability, with the strongest representation in social outcomes.

Social
38%
Environmental
33%
Economic
29%

Top improving metrics 2016 to 2023: LWZ +900%, EGF +900%, CFA +152%, PBA +6.4%, EIE +2.8%.

Platform

Everything you need for spatial circularity

Map neighborhoods, compare scores over time, export GeoJSON — without a GIS degree.

Interactive map

Color-coded neighborhoods with four switchable layers — CS 2016, CS 2023, change, and land surface temperature.

Track change

Compare circularity scores across years and spot neighborhoods improving or falling behind.

GeoJSON API

Authenticated REST endpoints return standard FeatureCollections for reports and pipelines.

SDG-aligned scoring

Select relevant UN goals, provide your neighborhood metrics, and GeoAI computes the circularity score for your scope.

Spatial data,
made human.

GeoAI is a research-driven framework, methodology, and analytical tool for measuring urban circularity. Combining GIS, machine learning, and SDG-aligned indicators, it turns complex sustainability data into a clear, actionable circularity score for any city.

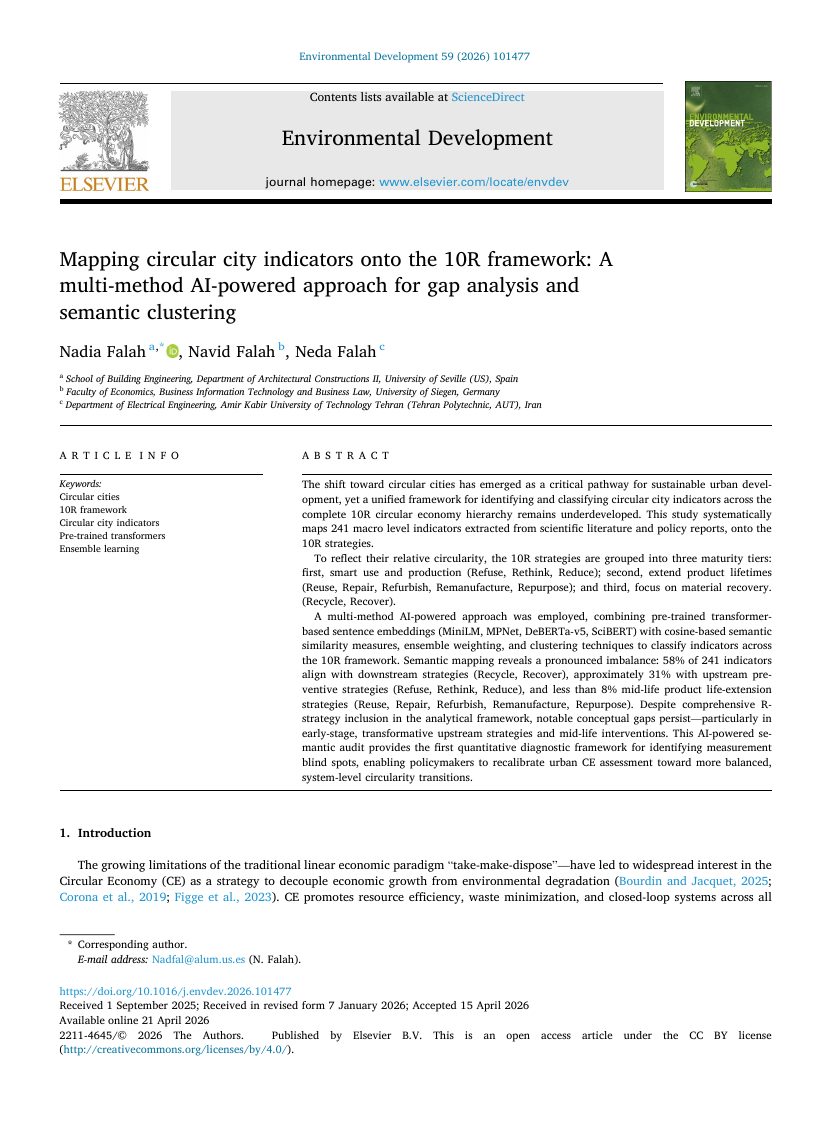
The methodology has been developed and rigorously validated through an in-depth application to the city of Seville, used to measure historical circularity performance (2016–2023), benchmark it against SDG 11 targets, and generate forward-looking projections of the city's future circularity trajectory. Grounded in the 10R framework and peer-reviewed research, GeoAI is built to scale beyond a single case study, giving planners and researchers a repeatable way to assess where a city stands today, and where it's heading.

Research & Recognition

Evidence that moves
urban thinking forward.

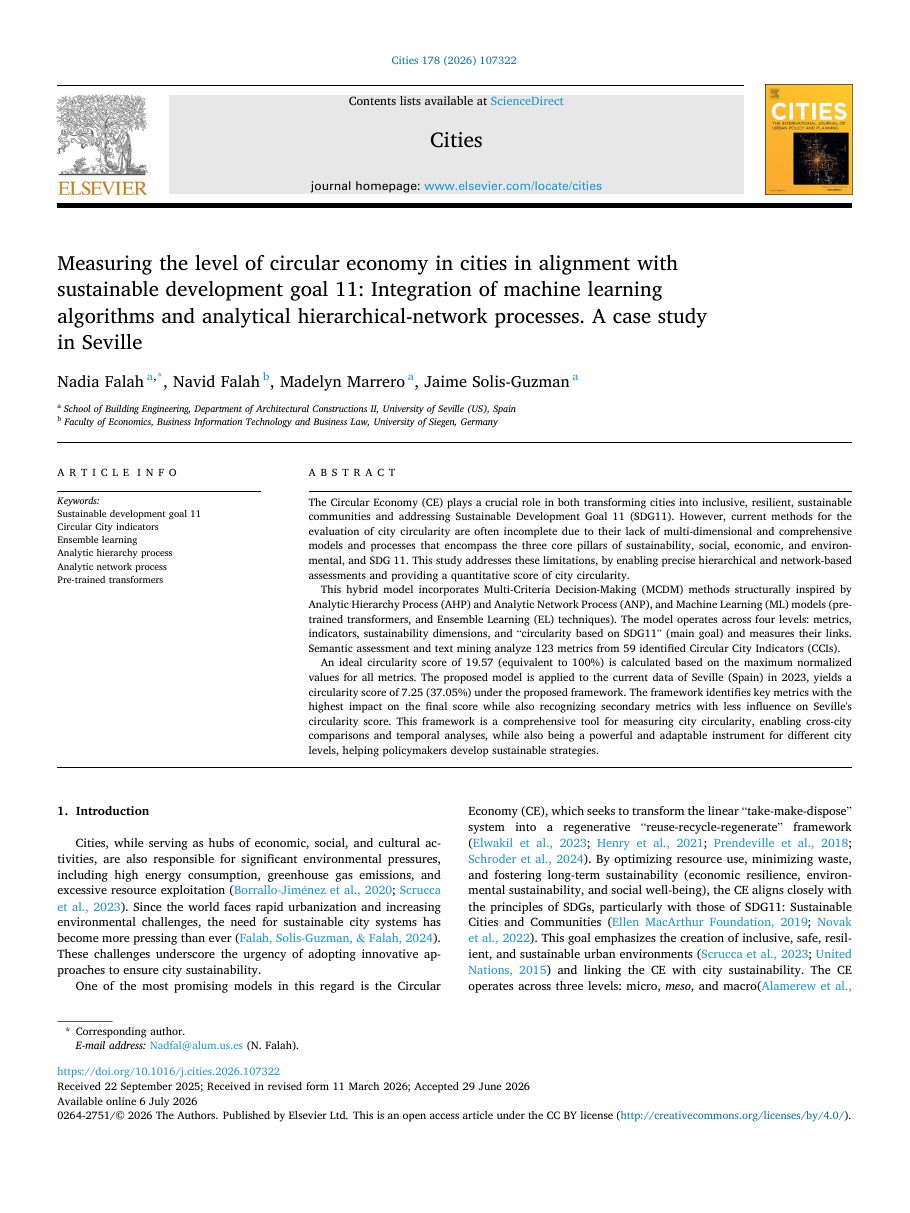
Peer-reviewed methods, an active research pipeline, and international recognition for practical urban circularity assessment.

Research output

04

Peer-reviewed publications

A growing evidence base connecting circularity indicators, urban GIS, machine learning, and the Sustainable Development Goals.

Active pipeline 2025—2026
Explore the research library

Evidence behind the platform

Research you can inspect.
Recognition you can verify.

Explore the peer-reviewed methods behind GeoAI and the official certificates recognizing the project.

Explore the full research library

Official recognition

Competition certificates · 2026
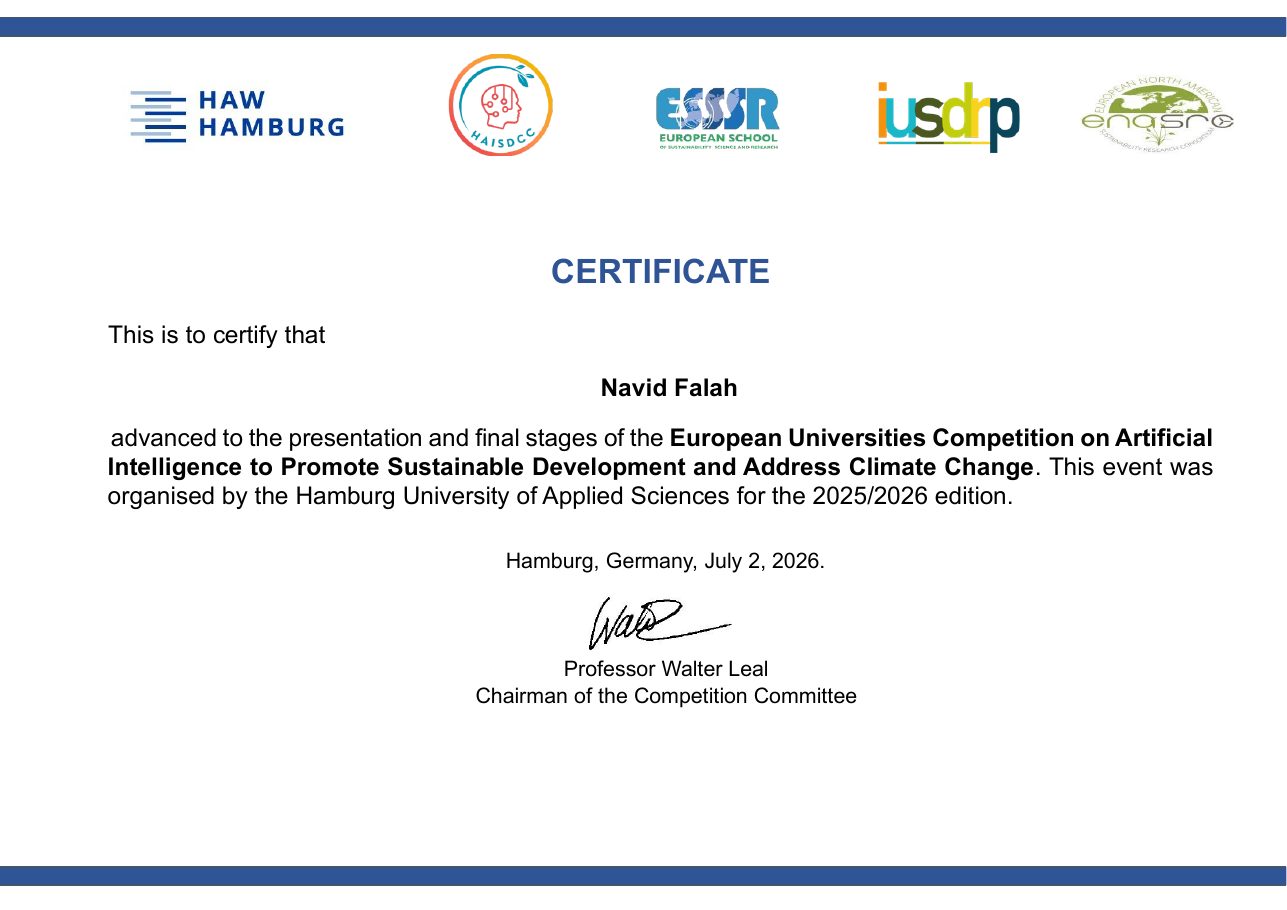
Hamburg AI sustainability competition certificate awarded to Navid Falah

Hamburg · July 2026

European Universities Competition on AI for Sustainable Development

Advanced to the presentation and final stages. View certificate
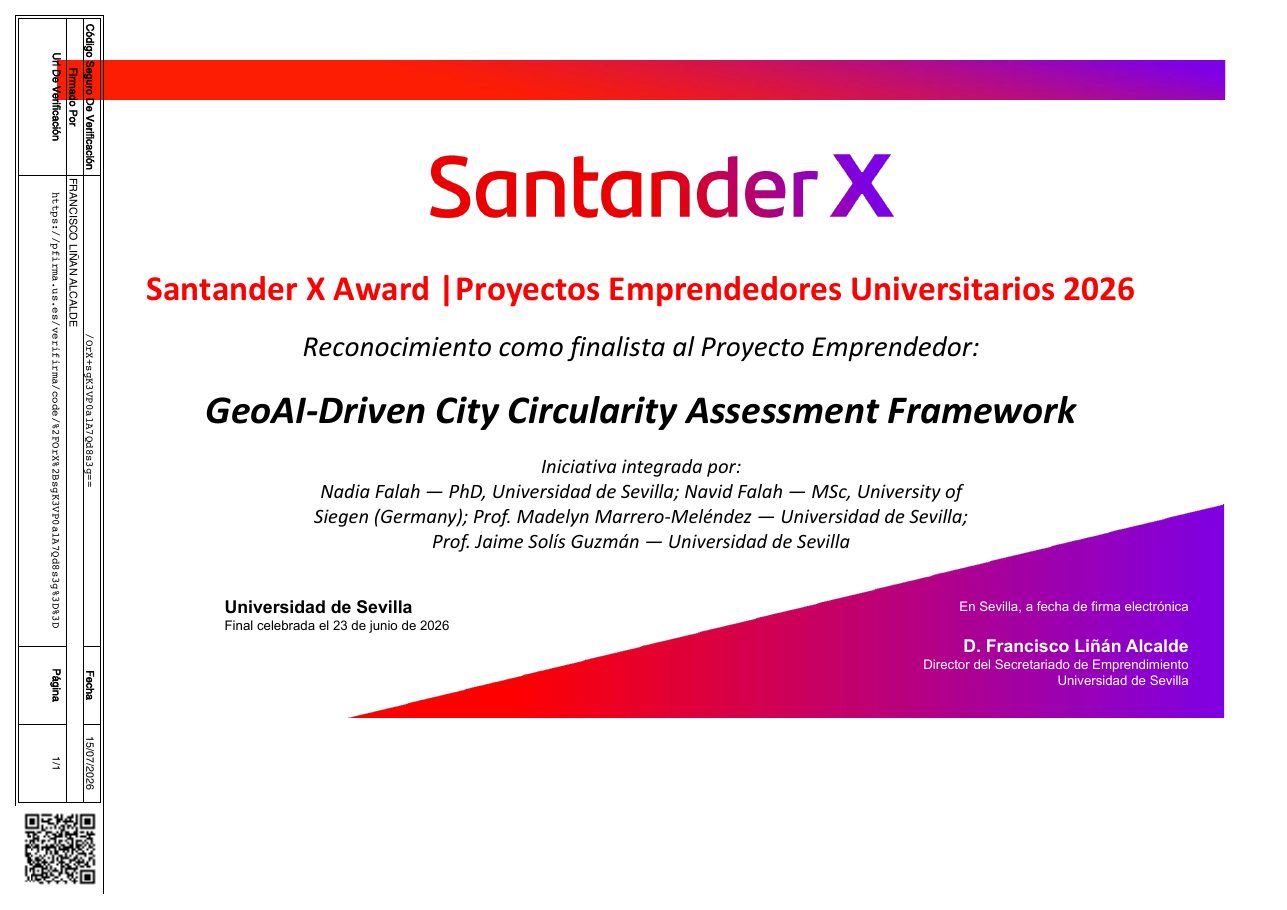
Santander X University Entrepreneurs finalist certificate for GeoAI

Seville · June 2026

Santander X Award — University Entrepreneurs

Official finalist recognition for the GeoAI framework. View certificate
Our team

Leading experts in urban sustainability

GIS, AI, urban planning, and sustainability — combined in one platform. Four peer-reviewed papers and international competition recognition.

Nadia Falah

Nadia Falah

PhD — Lead Researcher

University of Seville

Google Scholar ↗
Navid Falah

Navid Falah

MSc — ML & NLP Engineer

University of Siegen

Google Scholar ↗
FAQ

Common questions

Access, data, pricing, and support.

What is GeoAI and the Circularity Map?+
GeoAI is a GIS web platform for urban circularity analysis. The Circularity Map lets you explore neighborhood polygons, compare circularity scores over time, and overlay land surface temperature — all in a single interactive view built for planners and researchers.
What data does GeoAI use?+
The bundled demo uses eight Berlin districts in PostGIS — with circularity scores for 2016 and 2023, year-over-year change, and average land surface temperature (LST). Production deployments can load polygon layers and attribute tables for any city via standard GIS import workflows.
Who is GeoAI for?+
City planners, urban researchers, sustainability teams, and policy analysts who need spatial insight into neighborhood circularity. Whether you are evaluating heat islands, tracking score improvements, or briefing stakeholders, GeoAI turns complex GIS data into an accessible dashboard.
Which SDGs are supported?+
You select from relevant UN Sustainable Development Goals for urban circularity — such as sustainable cities, responsible consumption, climate action, and clean energy. Provide the neighborhood metrics you have and GeoAI maps them to your SDG scope to compute the circularity score.
How do I get access?+
Register or sign in with your account to explore the interactive map, sample neighborhoods, dashboard tables, and core metrics. For a guided walkthrough or custom deployment, contact us.
How does pricing work?+
GeoAI does not publish a public pricing page. Plans are tailored to your organization — SDG scope, data volume, deployment model, and partnership arrangements are quoted individually. Contact us with your use case and we will share details.
What map layers and dashboard features are available?+
The dashboard offers four switchable layers: CS 2016 and CS 2023 circularity scores, Change (absolute difference), and LST (land surface temperature). Click any neighborhood for detail cards, view aggregate stats, ranked tables, and a full sortable data grid.
Who is behind GeoAI?+
GeoAI is developed by researchers and engineers affiliated with the University of Seville and the University of Siegen — combining urban sustainability, GIS, and machine learning expertise.
How can I contact support?+
Email [email protected] or use the contact form for demos, pricing, support, and partnerships. We typically respond within 1–2 business days.

Start exploring your city.

Sign in with your account, or contact us for a guided walkthrough and custom deployment.

Sign in Request a demo